CI
CI is in charge of providing the infrastructure for a Continuous Integration and Continuous Delivery system (CI/CD).
Public Oath
As the CI/CD is the backbone of our technological operation, we will constantly look for new technology that improves our development, testing and release processes. Fluid Attacks will look for a CI/CD solution that is:
- Cloud based
- Scalable, so developers get feedback as soon as possible
- Secure
- Compatible with the rest of our stack
Architecture
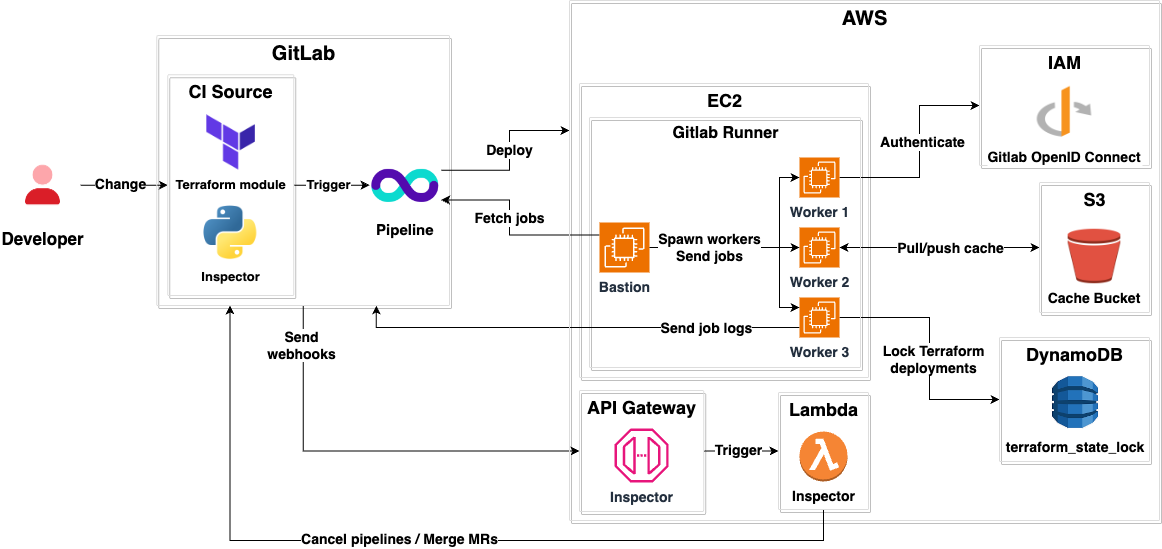
- The module is managed as code using Terraform.
- It implements an
inspectorAWS lambda that in Python. - Our CI/CD system is GitLab CI.
- It is hosted on AWS.
- It is an implementation of the terraform-aws-gitlab-runner module.
- Each product has a bastion machine that spawns workers based on job demand.
- Workers have an
aarch-64-linuxarchitecture. - There is a
common-x86bastion that spawnsx86_64-linuxworkers for jobs that only run on that architecture. aarch-64-linuxworkers have 1 vcpu and 8 GiB memory.x86_64-linuxworkers have 2 vcpu and 8 GiB memory.- Workers have Internet access.
- All workers have internal solid-state drives for maximum performance.
- Workers use the GitLab OpenID provider to assume AWS IAM roles provided by runs/users.
- There is a
terraform_state_lockDynamoDB table that allows locking Terraform states when deploying infrastructure changes, helping prevent state corruption. - It uses an AWS S3 bucket for storing cache.
- There is an API Gateway that receives merge requests and pipeline triggers from GitLab.
- The API Gateway forwards the requests to the Lambda.
- The Lambda performs the following actions:
- Cancel unnecessary pipelines.
- Rebase merge requests with trunk.
- Merge merge requests with green pipelines.
Contributing
Please read the contributing page first.
General
- Any changes to the CI pipelines must be done via Merge Requests.
- Any changes to the AWS autoscaler infrastructure must be done via Merge Requests by modifying its Terraform module.
- If a scheduled job takes longer than six hours, it generally should run in Compute, otherwise, it can use the GitLab CI.
Components
We use:
- terraform-aws-gitlab-module for defining our CI as code.
- GitLab Bot for listening to GitLab webhooks and triggering actions like canceling unnecessary pipelines, rebasing MRs and merging MRs.
- Terraform state locking to avoid race conditions.
Make the lambda review my merge request
The lambda reviews all currently opened merge requests when:
- A new merge request is created.
- An existing merge request is updated, approved (by all required approvers), unapproved, merged, or closed.
- An individual user adds or removes their approval to an existing merge request.
- All threads are resolved on the merge request.
If you want the lambda to rebase or merge your merge request, you can perform one of the previously mentioned actions on any of the currently opened merge requests.
Tuning the CI
Any team member can tune the CI for a specific product by modifying the values passed to it in the Terraform module runners section.
One of the most important values is the
idle-count, as it:- Specifies how many idle machines should be waiting for new jobs. The more jobs a product pipeline has, the more idle machines it should have. You can take the Integrates runner as a reference.
- It also dictates the rate at which the CI turns on new machines, that is, if a pipeline with 100 jobs is triggered for a CI with
idle-count = 8, it will turn on new machines in batches of8until it stabilizes. - More information about how the autoscaling algorithm works can be found here.
Terraform state lock
Sometimes, Terraform CI jobs get stuck in a failed state due to a locked state file.
The
Terraform state file stores local information regarding our infrastructure configuration, which is used to determine the necessary changes required to be made in the real world (terraform apply). This state file is shared amongst team members to ensure consistency; however, if it is not properly locked, it can lead to data loss, conflicts, and state file corruption. In case of conflicts with the state file, please follow the steps below:
- Navigate to the affected project path
- Go to the directory where the failed Terraform job is executed.
- Reinitialize Terraform
- Run: terraform init -reconfigure
- Force unlock the state
- Use the Lock ID reported in the job error: terraform force-unlock <LOCK_ID>
- Attempt to rerun the job that failed.
Debugging
As we use a multi-bastion approach, the following tasks can be considered when debugging the CI.
Review GitLab CI/CD Settings
If you’re an admin in GitLab, you can visit the CI/CD Settings to validate if bastions are properly communicating.
Inspect infrastructure
You can inspect both bastions and workers from the AWS EC2 console. Another useful place to look at when you’re suspecting of spot availability, is the spot requests view.
Connect to bastions or workers
You can connect to any bastion or worker using AWS Session Manager.
Just go to the AWS EC2 console, select the instance you want to connect to, click on
Connect, and start a Session Manager session.Debugging the bastion
Typical things you want to look at when debugging a bastion are:
-
docker-machinecommands. This will allow you to inspect and access workers with commands likedocker-machine ls,docker-machine inspect <worker>, anddocker-machine ssh <worker>. /var/log/messagesfor relevant logs from thergitlab-runner service./etc/gitlab-runner/config.tomlfor bastion configurations.
Debugging a specific CI job
You can know which machine ran a job by looking at its logs.
Consider an example job where the line Running on
runner-cabqrx3c-project-20741933-concurrent-0 via runner-cabqrx3c-ci-worker-skims-small-0-1677537770-87c5ed70... is displayed. This tells us that the worker with the name runner-cabqrx3c-ci-worker-skims-small-0-1677537770-87c5ed70 was the one who ran it.From there, you can access the bastion and run memory or disk debugging.
Custom API tooling
We’ve developed tooling specifically for monitoring job performance in CI. These tools interact directly with Gitlab’s GraphQL API, extracting and analyzing data to generate both plots and tabulated data in CSV format on your local machine.

Tip
All tools are accessible via the command line interface (CLI). Use the —help flag for detailed information on available arguments.
General analytics
Retrieve and visualize general job, pipeline or merge requests analytics using the CLI tool with its default workflow.
For fetching, parsing and plotting data, run:
runs-ci-analytics run default --resource=[RESOURCE]Optional arguments:
options:
  -h, --help            show this help message and exit
  --pages PAGES         Number of pages to process (default: 100)
  --time_scale {hour,day,week,month}
                        Time scale for grouping (default: day)
  --cache               Used cached data for producing figures instead of fetching new data
  --resource {jobs,pipelines,pipeline_insights,merge_requests}
                        Target resource to fetch (default: jobs)
  --target_job TARGET_JOB
                        Target job to fetch
  --product PRODUCT     Target product for pipeline analysis
  --match_type {contains,starts_with,ends_with,exact}
                        Match type for target resource filtering
  --ref REF             Commit reference to fetch
Functional tests
Identify the slowest and flakiest functional tests within integrations using the CLI tool:
runs-ci-analytics run functionalOptional arguments:
options:
  -h, --help            show this help message and exit
  --pages PAGES         Number of pages to process (default: 100)
  --time_scale {hour,day,week,month}
                        Time scale for grouping (default: day)
  --cache               Used cached data for producing figures instead of fetching new data
  --limit LIMIT         Limit of functional tests to display (default: 10)
End-to-end tests
Detect flakiness, generate heatmaps, and timing plots for end-to-end tests with the following CLI tool:
runs-ci-analytics run e2eOptional arguments:
options:
  -h, --help            show this help message and exit
  --pages PAGES         Number of pages to process (default: 100)
  --time_scale {hour,day,week,month}
                        Time scale for grouping (default: day)
  --cache               Used cached data for producing figures instead of fetching new data
  --limit LIMIT         Limit of functional tests to display (default: 10)
Customization
Easily create your own CLI tool to extract, parse, and visualize GitLab information by leveraging the module located at
runs/ci/analytics. Refer to the source code of the aforementioned tools for inspiration.More about Runs
Tip
Have an idea to simplify our architecture or noticed docs that could use some love? Don't hesitate to open an issue or submit improvements.